TPM Talk: Logs, Traces, and Metrics

Introduction
If you’ve spent any time working in software development or SRE teams, you’ve probably heard the terms logs, traces, and metrics thrown around. But what do they actually mean? And more importantly, why should Technical Program Managers care?
Observability isn’t just an engineering concern—it plays a huge role in how TPMs manage technical projects, facilitate incident response, and drive continuous improvements. Think of it like this: if your application is a mystery novel, logs, traces, and metrics are the clues you need to figure out who broke production.
Let’s break it down.
Logs, Traces, and Metrics: The Holy Trinity of Observability
Observability is about understanding what’s happening inside your system based on its external outputs. The three primary pillars are:
- Logs: The what—detailed event records.
- Traces: The where—context across services.
- Metrics: The how much—quantifiable performance indicators.
1. Logs: The Forensic Investigator
Logs are structured or unstructured event records that capture what happened at a specific point in time. Think of logs like a diary entry—each one records an event with relevant details, such as timestamps, request payloads, and error messages.
Example:
A simple log entry might look like this:
{ “timestamp”: “2025-02-01T12:34:56Z”, “level”: “ERROR”, “service”: “checkout-service”, “message”: “Payment gateway timeout”, “transaction_id”: “abc123xyz” }
When TPMs Care About Logs:
- Incident response: “What exactly happened before the system failed?”
- Debugging discussions: “Did we see similar errors in past deployments?”
- Compliance & audits: “Are we capturing sensitive events properly?”
💡 “Logs are invaluable for post-mortems and debugging, but they can be expensive to store and search through.” – Charity Majors, CTO at Honeycomb
2. Traces: The Detective Work
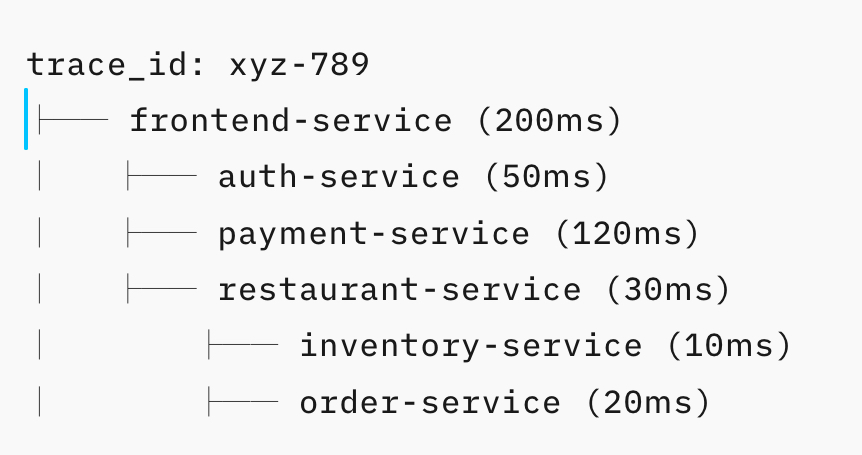
Traces help track how a single request moves through a distributed system. They provide end-to-end visibility into how different services interact, showing the sequence of function calls and dependencies.
Imagine ordering food through a delivery app. A trace would capture:
- Your request hitting the frontend
- The payment service processing your order
- The restaurant service confirming availability
- The delivery service dispatching a driver
Each step is a span in the trace, stitched together by a unique identifier called a trace ID.
Example:
A trace visualized in an observability tool (e.g., Jaeger, OpenTelemetry) might look like this:

When TPMs Care About Traces:
- Debugging slowdowns: “Where in the stack is the request
- slowing down?”
- Service dependencies: “Which microservice is causing failures upstream?”
- Latency SLAs: “Are we meeting performance guarantees?”
📢 “Tracing connects all the dots—helping us visualize complex, distributed systems in ways that logs alone can’t.” – Ben Sigelman, Co-founder of LightStep
3. Metrics: The Heartbeat of Your System
Metrics are numerical data points that track performance trends over time. Unlike logs and traces, which focus on specific events, metrics provide aggregated insights into system health. Common Types of Metrics include:
- Latency: How long requests take to complete
- Error rates: Percentage of failed requests
- Throughput: Number of requests processed per second
- CPU & memory usage: Infrastructure health
Example:
If your API latency suddenly spikes from 100ms to 500ms, metrics will flag the anomaly, prompting engineers to dig into logs or traces for root causes.
When TPMs Care About Metrics:
- Capacity planning: “Do we need more resources to handle Black Friday traffic?”
- SLO/SLI compliance: “Are we meeting service-level agreements?”
- Anomaly detection: “Why did API failures jump by 300% overnight?”
🔍 “Metrics are like the stock market—they show trends, but you need logs and traces to understand the story behind them.” – Liz Fong-Jones, Principal Developer Advocate at Honeycomb
How Logs, Traces, and Metrics Work Together
Think of observability like investigating a crime:
- Logs = Witness Statements: “I saw an error at 12:34 PM.
- Traces = Security Camera Footage: “Here’s how the request moved through our services.”
- Metrics = Crime Statistics: “We’ve seen a 20% increase in failures today.”
TPM Takeaways: Why You Should Care
- Improved Incident Response – Faster RCA (Root Cause Analysis) means shorter outages.
- Better Communication – Speak the same language as engineers when discussing system health.
- Data-Driven Decision Making – Use observability insights for capacity planning and risk management.
My Closing Thoughts
As TPMs, we don’t need to be deep in the weeds of logs, traces, and metrics—but understanding them helps us drive reliability, scalability, and effective incident response. Next time an engineer mentions OpenTelemetry, Grafana, or Prometheus, you’ll know exactly what they’re talking about.
Got stories about using observability to solve real-world problems? Share them in the comments!
References & Further Reading
- Charity Majors, Honeycomb: The Three Phases of Observability
- Ben Sigelman, LightStep: Tracing vs. Logging vs. Metrics
- Liz Fong-Jones, Honeycomb: Metrics vs. Logs vs. Tracing
- Google SRE Book: Monitoring Distributed Systems


